AN ILLUSTRATED HISTORY OF AMERICA’S PLANT HARDINESS ZONES (With a Closing Look at One North Carolina County (Wake) and 2023 Update)
While browsing at the nursery, you pluck the pointed plastic label from the plant’s container, wipe off the moist soil with your finger and look at the plant’s name, sun requirements and its “USDA Zones.” Or, while shopping online, a major national nursery has “USDA Zone” next to each plant. When you click, the site explains, “There are very few rules in gardening, but perhaps the most important one is to work within your zone. Our zone finder tool is based on USDA Plant Hardiness Zone Map which is the standard by which gardeners and growers can determine which plants are most likely to thrive at a location.”¹ Experienced gardeners know that by identifying the USDA plant hardiness zone in which they live it can then be determined if a particular plant can survive in the garden because it can withstand the average annual minimum temperatures associated with the zone.
There are of course other factors to be considered when determining the potential viability of a plant in a geographic location, but the use of the average annual minimum temperature provides a universal baseline to be used by all. As one of the early pioneers in the use of plant hardiness maps explained in 1940:
“Hardiness of plants is an indeterminable quantity, based not only on a plant’s resistance to minimum temperatures, but also on its resistance to maximum temperatures, and other factors such as lack of water, exposure, soil conditions, length of growing season, etc. It would be impossible to prepare a map depicting all these factors, though several might be included on a complex one. However, since a map based on the average annual minimum temperatures agrees in many instances with the known limit of hardiness of certain plants, these data were adopted as the basis for hardiness zones.”²
This view has endured and recently was expressed as:
“The extremes of winter cold are a major determinant of natural plant distribution and the successful cultivation and survival of long-lived plants. In the United States, the USDA Plant Hardiness Zone Map is the primary reference for defining and communicating the geospatial patterns of extreme winter cold to the horticulture and nursery industries, agrometeorologists, and plant scientists.”³
The history of how these zones came to be developed involves pioneering horticulturalists and colorful, hand-drawn maps from decades ago. This is the story of how the “USDA Zones __” on your plant tag came to be, what they mean and why they are still in use almost 100 years after the first plant hardiness maps were developed. There do exist what is becoming a myriad of various “plant hardiness” type maps which focus on other weather data, specific regions and different purposes, and which are beyond the scope of this article. Nonetheless, the USDA Plant Hardiness map remains the most commonly used standard by the plant industry and gardeners for assessing plant hardiness in the United States.⁴
This is the first known plant hardiness map, published in the Manual of Cultivated Trees and Shrubs Hardy in North America in 1927.

It was devised by Alfred Rehder
who for much of the first half of the 20th century years was an internationally renowned botanical taxonomist and dendrologist at Harvard University’s Arnold Arboretum in Boston.
Rehder divided the United States and southern Canada into eight zones consisting of 5° bands of differences in lowest mean temperatures of the coldest month of the year. As the initial attempt at establishing hardiness zones, the map today looks a bit primitive, as it should given its vintage, using broad approximations and based on relatively limited weather data. It also happens to be missing most of Florida and the lower parts of Louisiana and Texas.
Here is the same map with coloring hand drawn by Rehder himself.
This shading, perhaps with a crayon or colored pencil, reveals an intimate personal touch. As will be discussed later, this human involvement fortunately still exists even in developing modern day plant hardiness zones maps.
Rehder’s sweeping bands of hardiness had their origin in the work of German geographer Alexander von Humboldt
who is believed to have developed the first map with zones of equal climatic conditions, or isotherms. His first known map was published in an early world-wide atlas in 1845.
Another, even earlier, global climatic map was discovered, but it is not known if Rehder was aware of it. This map portrays isothermal bands circling around the globe and was created by
William Channing Woodbridge of Connecticut.⁹
The map appears to have been drawn around 1823 and published in 1830. Significantly, it foreshadows Rehder’s and other’s hardiness zone maps by describing bands moving through regions on the map described as Hot, Warm, Temperate, Cold, Wintery and Frozen. These early maps also are especially significant as reflecting the nascent thought that isothermal lines slice through latitudes at different angles, contrary to the then prevailing notion that climate was directly related to latitude.
However, while it may appear from the literature that after Rehder’s 1927 map the horticultural community primarily referenced updates published by the Arnold Arboretum, a significant map was published in 1928, found deep inside a dense United States government publication. The 1928 Atlas of American Agriculture, Climate. Temperature, Sunshine, and Wind published by the USDA contained climatic maps prepared by J.B. Kincer, including this map (on top of page).
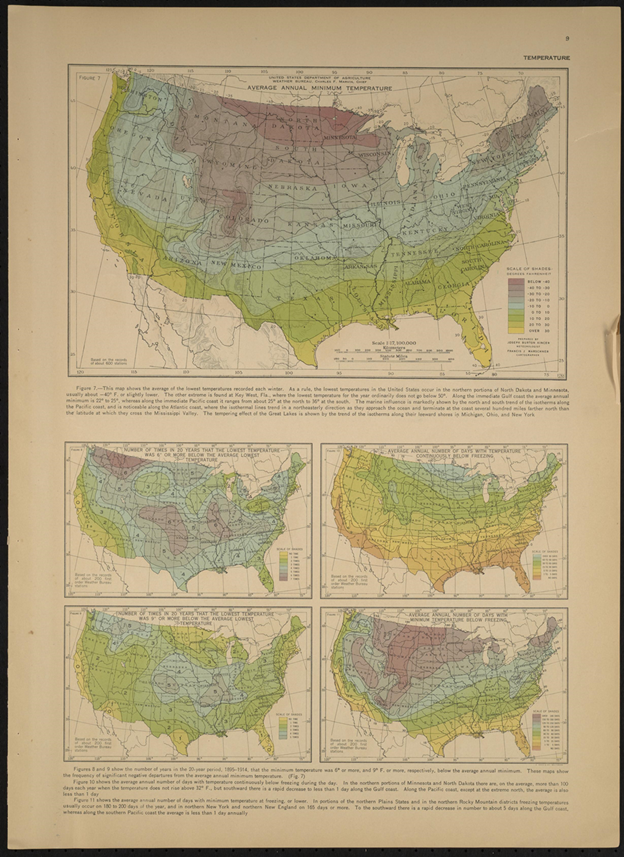
While somewhat lost to obscurity, perhaps because it was just one of many maps in the publication or, unlike Rehder’s work, numbered zones were not assigned, it nonetheless appears to be the first USDA map to depict average annual minimum temperatures in zones across the United States. Even more significantly, Kincer used the measurement of the lowest recorded temperature in a year, then averaged those over a number of years, in order to arrive at the zones in the map. This differs from Rehder’s use of the average low temperatures for the coldest month, which would result in higher temperatures being used since it averaged all the low temperatures for the coldest month, instead of using solely the coldest temperature of the year. Kincer’s use of this particular measurement (referred to as the “plant hardiness (PH) statistic”) would later be adopted by the USDA when it started publishing plant hardiness maps by that name in 1960 and continues to the present.
There is not much, if any, reference in the horticultural literature to Kincer’s map after it was published. The next plant hardiness map of import published was in 1938 when horticulturist Donald Wyman
of the Arnold Arboretum enhanced Rehder’s map.
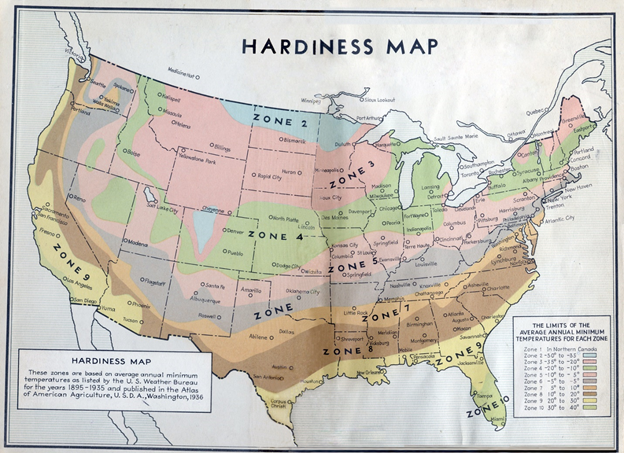
Wyman used previously unavailable temperature data from the U.S. Weather Bureau from the years 1895–1935. Significantly, he based the new isotherm contours on the average annual minimum temperatures, just as Kincer had done in 1928. Wyman’s temperature bands, however, differed by 5°F, 10°F, and 15° F, depending on the latitude. For example, average winter minimums on the map’s zone 3 range from -35° to -20°, a difference of 15°, but Zone 7 for example has only a 5° spread.
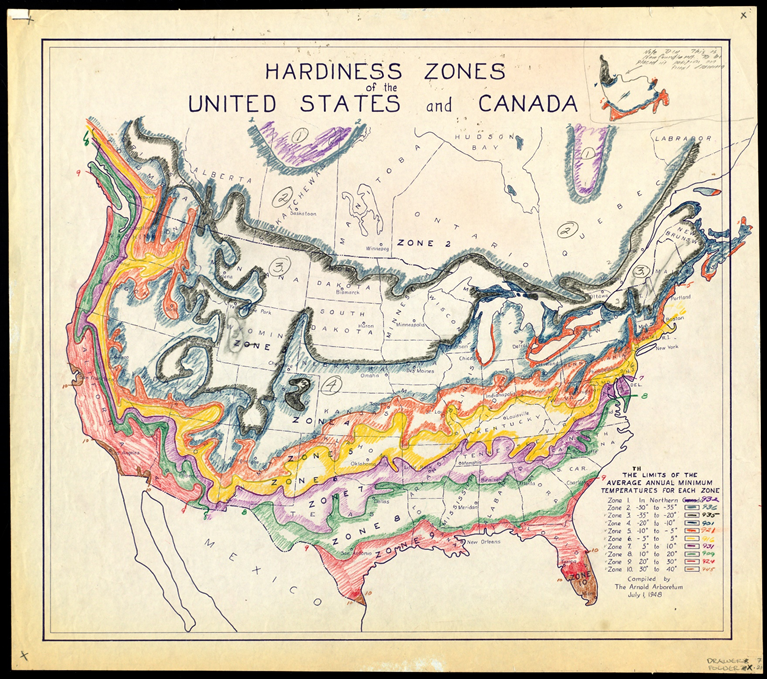
Wyman and the Arnold Arboretum continued to revise and update the plant hardiness map, including these 1948 maps, one with Newfoundland added with a taped page and another attractively colored map drawn by hand.

The above maps likely were drafts of the more polished, finalized 1948 map by Wyman and the Arnold Arboretum which incorporated new weather data.
Interestingly, in 1950 the Arnold Arboretum even placed notable arboretums and botanical gardens in the United States onto the existing plant hardiness zone map.
Wyman in 1967 published a new map, updated to reflect new weather data.
Here is what appears to be a draft or working copy of the 1967 map.
… and here is the final1967 map:
However, due to the lack of uniformity in the zone intervals in the Arnold Arboretum maps, the USDA developed and published a Plant Hardiness Zone Map [PHZM] in 1960. Dr. H.T. Skinner, the longtime Director of the National Arboretum, was chiefly responsible for the development of this map. Interestingly, Dr. Skinner worked as an intern at the Arnold Arboretum during when the first hardiness zone map was developed there in the late 1920’s.
Evidently, the introduction of the USDA map came as a surprise to Wyman. Like any other member of the public, he had to write to the USDA to request copies of the map. His 1960 correspondence reflects his having to resort to informing the USDA of his many years of having worked on the topic and that the Arnold Arboretum’s hardiness map had been universally adopted until the USDA map came along.

Wyman’s frustration with the situation comes out in a 1969 letter in which, while he refers to the USDA’s publication as a nice looking map, he goes on to describe its shortcomings, how the new map has resulted in “farcical errors,” and how the Arboretum’s maps are really all that horticulturists need.

In an attempt to reconcile the two maps, Wyman subsequently published a table showing the differences between the two numbering systems used in his map and the new USDA map. However, the horticultural community experienced some confusion by being presented with these two different appearing maps. Despite his plaintive conclusion in the above 1969 letter of “What more can you ask” of the Arnold Arboretum’s efforts, eventually use of the USDA map increased with the USDA’s newly consistent zone designations and it became the standard for assessing plant hardiness in the United States.¹⁹
The 1960 USDA map:
Subsequently, an interesting development was reported in the May 1976 edition of the magazine of the American Association of Nurserymen. The legislature of a state, which was unnamed, was seriously considering passing a law which would make it a crime to sell plants that were “not hardy” in the region in which the plants were being sold. This proposed law was opposed by the nursery industry and ultimately not passed.
Interestingly, the magazine also included an article which provided information to the nursery industry to use in case similar legislation was proposed elsewhere. The article made the point that “hardiness” defies legal definition because of all the variables involved in the health of a plant and the geographical origin of trees or shrubs with a wide latitudinal range in nature. The existence of microclimates also complicates matters. Unusually cold winters which do not repeat themselves also are a confounding factor. The article also pointed out that at the time there were two competing hardiness zone maps in use, one from the Arnold Arboretum and one from the USDA. The map from the Arnold Arboretum had come under criticism for being compiled on too large a scale to be really accurate. Critics of the USDA map said that some of the detailing was too inaccurate and that the assignment of plants to its various zones had been on a “too short term and haphazard basis.” The article concluded that the existence of these two competing maps and the rivalry between their adherents was “eloquent testimony” to the fact that what should appear on a list of plants hardy in an area is a matter of opinion and was impossible to be legislated.
The USDA updated its PHZM (Plant Hardiness Zone Map) in 1990.
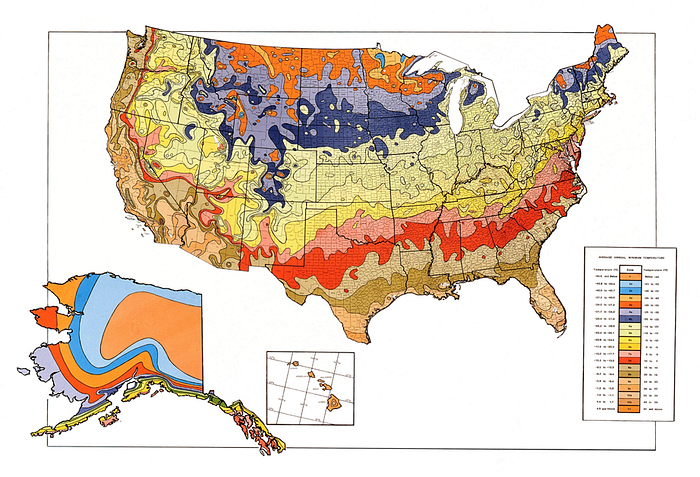
The 1990 edition of the map consisted of the average annual minimum temperatures based on the lowest temperatures recorded for each of the years 1974 to 1986 in the United States. It showed 10 different zones and introduced a zone 11 to represent areas that were essentially frost free. Almost 8,000 weather stations within the involved latitudes and longitudes for the U.S., Canada and Mexico were identified and those with valid average annual minimum temperatures based on at least 10 years of data were used.²² This also is the last USDA PHZM prepared by hand.²³
The USDA Plant Hardiness Zone Map was published in 2012 and can be found here. It has new features, including being able to access hardiness data by zip code.

The 2012 map differs from the 1990 map in that the for the first time it was in a digital format and would be maintained on the internet. The development of the map is explained in detail in a scientifically thorough 2012 article in the Journal of Applied Meteorology and Climatology.²⁴ Highlights from the article include:
* The map focuses solely on the PH statistic, that is, the lowest temperature of each year recorded at weather stations from 1976–2005 and then averaged.
* This one dataset was used due to its widespread adoption both in the United States and internationally. As the article notes, “Accurate prediction of winter injury is a key component to the successful cultivation and survival of long-lived woody and herbaceous perennial plants in many regions of the world. The frequency and severity of winter injury are also important determinants in the natural distributions of many temperate plants.”²⁵
* Instead of the 13-year data set used for the 1990 map, the 2012 map included 30 years’ worth of data. This longer period of time was chosen because “… it was more stable statistically, samples recent climatological variation more completely, and yields a clearer picture of the role that past winters have played in the survival of long-lived plants.”²⁶
*An interesting glimpse into climate reports reveals that the weather station data used is incomplete, but this evidently is acceptable (with limitations) in the meteorology field. Most of the weather stations in the country are referred to as “COOP” stations, which are stations operated by volunteers, typically at most only record findings once a day and not unusually are missing a significant number of weather observations throughout a year. There exist other weather stations, but far fewer in number, which are operated or monitored by professionals, record observations hourly, undergo more rigorous quality control checks and are not known to have missing information. The following are images of the COOP station in Cary, NC which sits in someone’s neighborhood front lawn, a weather station in someone‘s backyard in Falls Lake, NC, the model of which can be bought online at Amazon, and a photograph of the First Order professionally maintained weather station at the Raleigh-Durham Airport in North Carolina.


*The quality threshold for weather stations to be used in development of the 2012 map was that they had to have at least 24 days of minimum temperature data during each of the months between October and March for at least 10 of the 30 years involved in the study, and they were then put through other quality control procedures. So, otherwise stated, a weather station missing 20 percent of its relevant weather data and for as much as 66 percent of the time-period involved would still be used.
*This is not necessarily a criticism of this methodology, but more of an insight afforded to gardeners into how climate statistics are derived. Of the 7,983 weather stations used in developing the map, only a small portion are professionally operated or monitored with consistent recording of observations. Nonetheless, the 2012 map clearly is significantly more sophisticated than prior maps and the result of use of updated, modern technology.
* Despite the use of advanced technology, the human element remained in the formation of the 2012 map. As explained by the USDA, once an initial draft of the map was produced, people from the agricultural, climate and horticultural communities were able to comment on whether certain parts of the map were too warm or too cold in their opinions, and changes were made based on this human input.²⁷ While not the same as colleagues gathered around the drafting table while the 1927 and 1928 maps were drawn up by Rehder and Kincer, it nonetheless is reassuring to see the human touch involved.
* It is important to keep in mind that the 2012 map reflects the average lowest winter temperature for a given geographic area for this 30-year period but does not necessarily represent the coldest it has ever been. This would be due to data from prior to 1976 not being included and because many of the weather stations used have missing days of data.
* The USDA plant hardiness map is not an indicator of whether global warming/climate change/climate crisis is occurring. The USDA states, “Climate changes are usually based on trends in overall average temperatures recorded over 50–100 years. Because the USDA PHZM represents 30-year averages of what are essentially extreme weather events (the coldest temperature of the year), changes in zones are not reliable evidence of whether there has been global warming.”²⁸ The founder and director of Oregon State University’s PRISM Climate Group, which per contract with the USDA created the 2012 map, also commented, “Plant hardiness is ‘a really volatile statistic in time. It’s only one day per year over 30 years. Even if the average is slowly creeping up on us, as a single, volatile statistic it’s just not a very good metric for looking at climate change.’”²⁹
*Even though the data in the 2012 map is as of 2005, the USDA reports that a check of more recent data did not find that adding the more recent years of data would make a significant difference in the definition of the zones.³⁰
WAKE COUNTY, NORTH CAROLINA
As this piece was originally written and published in 2020 in the state capital of North Carolina, Raleigh (Wake County), a brief note is made about its plant hardiness zone status. Wake County for decades lived in the Zone 8, 10–20° average annual minimum temperature zone, starting with Kincer’s USDA map of 1928 and in the succession of Arnold Arboretum maps. Wake County continued to reside in this Zone 8 through the USDA map of 1960, where it was within Zone 8(a) until 1990. However, it was placed into Zone 7(b) (5–10°) in the USDA maps of 1990 and 2012, where it predominantly remains today.³¹ So, whenever the USDA map is next updated Wake County may find itself in Zone 7(a), still primarily in Zone 7(b), or Zone 8 may come back to all or most of Wake County, where it previously was for over 60 years, from 1928 until the 1990 USDA map was published.
2023 Update
The USDA issued a new Plant Hardiness Zone Map in November 2023, which can be accessed at this link: https://planthardiness.ars.usda.gov/
This is an image of the new map:
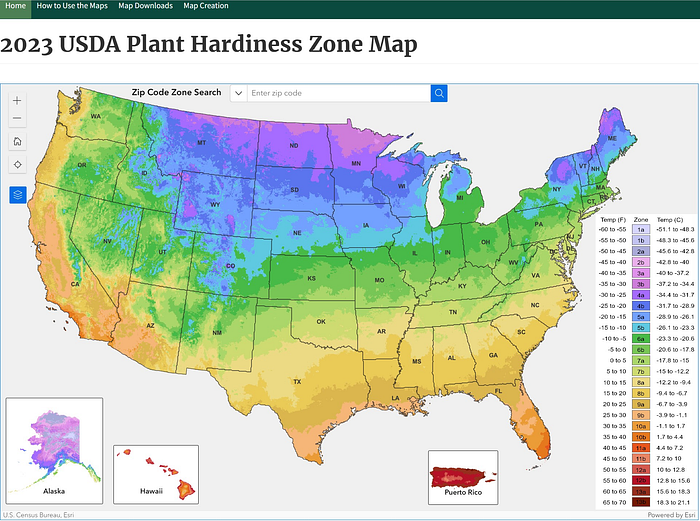
Recall that the last map was issued in 2012 and based on weather data from 1976–2005, while the new 2023 map is based on data from 1991–2020, the data still being the lowest single temperature each year for 30 years and then averaged. The map was created by the same PRISM Group at Oregon State University which developed the 2012 map, using the same methods and approach for the 2023 map, so the above observations regarding this process (for example, quality of data and weather stations) is still applicable.
The new zones can be found either by way of zip code entry or viewing a high-resolution map. It appears that many North Carolina counties have been redesignated half a zone up. For example, While Wake County in the 2012 map was mostly zone 7b (temperature range of 5°-10°) with spots of zone 8a (10°-15°), in the new map Wake County has returned to being in zone 8 (8a) where it previously had been from 1928 until the 1990 hardiness zone map. A comparison of the new map with the maps from earlier times (see above) reflects that most, if not all, of the counties in North Carolina have returned to their prior zone designations from the 1928–1990 period. A glance at other parts of the country bears this out as well.
The USDA again cautioned that because the new map represents only 30-year averages (instead of 50–100 year averages) of what are essentially extreme weather events occurring on a single day, that is, the coldest temperature of the year, “changes in zones are not reliable evidence of whether there has been global warming.” Additionally, in addition to the temperature data collection, zone changes also resulted from additional data sources and improved numerical analysis methods.³²
The USDA also reiterated that the hardiness zone maps are only a guide and that what has thrived in yards will most likely continue to thrive and that, “No hardiness zone map can take the place of the detailed knowledge that gardeners learn about their own gardens through hands-on experience.”
This cautionary language comes into play if one reviews the actual minimum temperatures occurring in an area. For example, in Wake County, in the past 30 years from 1993–2022, in nine different winters, including as recently as 2022, the minimum temperature was 10° or less, in other words, zone 7b, 7a (0°-5°) and even 6a (0°- minus 5°) temperatures. These nine minimum temperatures were 0°, 1°, 2°, 4°, 7°, 7°, 9°, 10° and 10°.³³
One well-known local nursery owner recently found that according to temperature readings on his property in Wake County, there have been six winters during the most recent 30-year dataset when temperatures dipped below the minimum 8a temperature threshold. “Since the purpose of the map is to show people what they can grow in each zone, this is troubling,” he noted. He pointed out this means that for those gardeners who may have planted based on a minimum zone 8a, instead of 7b, they would have lost their plants every five years.³⁴ This would happen even more often using the other Wake County minimum temperature figures noted above.
Realistically, many gardeners do not research the history of minimum temperatures in their area and will rely just on whatever zone is listed next to a plant description at the nursery or online. Perhaps someday the USDA will be able to incorporate this minimum temperature information into at least their online maps. A couple of possible ways include including the percentage of years with “subzone” minimum temperatures from the prior 30 years, or even coming up with a new 30-year average by decreasing the average low temperature from the prior 30 years by that same percentage. In any event, until then what the zones in one sense mean is that the odds are with the gardener, but only for an unpredictable number of years, if he or she plants, for example, an 8a minimum plant in zone 7b, but there likely will come a reckoning when the plant at some point will be killed by a “below zone” minimum temperature freeze or at least extraordinary measures will need to be taken to protect it.
Gardeners are well advised to learn about minimum temperatures in their area before making planting decisions if these below zone temperatures would result in a particular plant meeting its demise. A reasonable approach may be for gardeners to plant by the rule of always planting at least one zone below their designated hardiness zone in order to avoid the scenarios described above.
By Tom Packer, President of the Gardeners of Wake County, Board Member of the North Carolina Cooperative Extension Agricultural Programs Foundation, North Carolina State Extension Certified Master Gardener, Moderator of “Gardening Carolina” Facebook Group and longtime backyard farmer in North Carolina and Northern California. Other horticulturally related articles by Mr. Packer can be found at https://medium.com/@tpacker25. All this article’s content is that of Mr. Packer alone as an individual and not as a member of or on behalf of any organizations or groups with whom he is affiliated.
___________________________________________________________________
[1] Monrovia.com and https://drive.google.com/file/d/1ZYAc7dsGo2_vl92HtR4a1FeH_6hXSj48/view?usp=sharing
[2] Wyman, Donald. “A HARDINESS MAP FOR THE UNITED STATES.” Bulletin of Popular Information (Arnold Arboretum, Harvard University), vol. 8, no. 12, 1940, pp. 61–64. JSTOR, www.jstor.org/stable/42962115; https://drive.google.com/file/d/1z-8_6wBNGnpPiMv3e4LD7-u-Ex9fGxDQ/view?usp=sharing. Accessed October 4, 2020.
[3] Daly, C., M.P. Widrlechner, M.D. Halbleib, J.I. Smith, and W.P. Gibson. 2012. Development of a new USDA Plant Hardiness Zone Map for the United States. Journal of Applied Meteorology and Climatology, 51: 242–264 at 259 Link to article
[4] https://www.almanac.com/content/plant-hardiness-zones# and https://drive.google.com/file/d/10fG40HTS9pjfWYV9zVL3rActf4BDnqRm/view?usp=sharing
[5] https://www.flickr.com/photos/usdagov/6862204426/in/photostream/
[6] Image courtesy of Arnold Arboretum Archives
[7] Image courtesy of Arnold Arboretum Archives
[8] System Der Isotherm-Kurven in Physikalischer Atlas. Heinrich Berghaus, 1845. Image from Geography and Map Division, Library of Congress
[9] https://en.wikipedia.org/wiki/William_Channing_Woodbridge
[10] Isothermal Chart, or View of Climates & Production in Woodbridge’s School Atlas to Accompany Woodbridge’s Rudiments of Geography: Atlas on a New Plan . . . William C. Woodbridge, 1830. Geography and Map Division, Library of Congress. See also, https://blogs.loc.gov/maps/2018/04/the-first-isothermic-world-maps/ and https://drive.google.com/file/d/1IMPz5OYOMkmxucrhqE1uKrGgCPGDSEEp/view?usp=sharing
[11] https://archive.org/details/CAT31378527007/page/n17/mode/2up See, p. 10.
[12] Image courtesy of Arnold Arboretum Archives
[13] https://www.flickr.com/photos/usdagov/7008319727/in/photostream/
[14] Image courtesy of Arnold Arboretum Archives
[15] https://www.flickr.com/photos/usdagov/7008320087/in/album-72157627857689389/
[16] Image courtesy of Arnold Arboretum Archives
[17] Image courtesy of Arnold Arboretum Archives
[18] https://www.flickr.com/photos/usdagov/7008320087/in/album-72157627857689389/
[19] Daly, C. (n 3) at 259
[20] https://www.flickr.com/photos/usdagov/7008290183/in/photostream/
[21] https://www.flickr.com/photos/usdagov/6862173684
[22] United States Department of Agriculture, Agricultural Research, Miscellaneous Publication №1475
[23] Daly, C. (n 3) at 243
[24] Daly, C. (n 3)
[25] Daly, C. (n 3) at 242
[26] Daly, C. (n 3) at 244
[27] https://drive.google.com/file/d/1PdH0jd1rgcnBRH4KVdA0Mv6oQAMekNC8/view?usp=sharing and http://web.archive.org/web/20201202061642/https://planthardiness.ars.usda.gov/PHZMWeb/About.aspx
[28] https://drive.google.com/file/d/1MA7gw5GgsVCusiA8JwzZaUqvsFqRN6AV/view?usp=sharing , http://web.archive.org/web/20201114005450/https://planthardiness.ars.usda.gov/PHZMWeb/AboutWhatsNew.aspx and https://planthardiness.ars.usda.gov/pages/map-creation#:~:text=Climate%20Change,been%20global%20warming.
[29] https://www.wiscontext.org/where-wisconsin-do-hardiness-zone-shifts-reflect-changing-climate
[30] https://drive.google.com/file/d/1MA7gw5GgsVCusiA8JwzZaUqvsFqRN6AV/view?usp=sharing and http://web.archive.org/web/20201114005450/https://planthardiness.ars.usda.gov/PHZMWeb/AboutWhatsNew.aspx
[31] https://drive.google.com/file/d/17lXEDuy5lA9Kv-qz5cpj6DXhTiDm7bfK/view?usp=sharing and What’s New | USDA Plant Hardiness Zone Map (archive.org). Focused viewing of an enlarged Wake County on the USDA interactive online map reveals some thin shaded areas in the color representing zone 8(a) along its southern and southeast borders and a few small, isolated areas (one being where a large, local shopping center is located) elsewhere. Interestingly, however, there are no, and never have been any, reporting weather stations in these areas. Moreover, the listing of plant hardiness zones by zip code by the PRISM Group reflects that all zip codes in Wake County are designated as being in zone 7(b). See, CONUS ZIP Code Listings at https://prism.oregonstate.edu/projects/plant_hardiness_zones.php . Inquiries about this issue to the USDA’s designated email address for questions about the hardiness zone map did not receive a response.
[32] https://planthardiness.ars.usda.gov/pages/map-creation and https://drive.google.com/file/d/17OQJB13MhECetKGJBaPAqX8Ib7BIFmUW/view?usp=sharing
[33] http://xmacis.rcc-acis.org/ : single station/seasonal time series/ min temp/minimum/ 1993–2022 / Station: Raleigh Area/ RDU